verifiedPeel Heat Vulnerability Index
HVI item used for public-health heat-risk context and source metadata.
Sources
Every data layer, candidate building, and photo is linked to its public source, with short, plain answers to the obvious hard questions.
Where the data comes from
Six map layers, each a snapshot of a named public source. Nothing here is generated or guessed, and nothing is fetched live while you browse.
peel-hvi.geojson282 census tractsA static export of Peel's public Extreme Heat Vulnerability Index feature service: the overall quintile plus exposure, sensitivity, and adaptive-capacity sub-scores. Re-verified against the live service on 2026-05-26.verifiedpeel-flood.geojson295 polygonsTRCA's 'Flood and Heat Vulnerable Areas in Peel' service, layer 6 (Floodline TRCA Polygon): the riverine regulatory floodplain, the greater of the Hurricane Hazel Regional Storm or the 100-year flood, for the Humber, Etobicoke Creek, and Mimico Creek watersheds. Not urban or storm-sewer flooding. Per-building flood proximity was point-queried against this layer and cross-checked with a local point-in-polygon pass.verifiedpeel-winter-vuln.geojson282 census tractsThe 2021 Ontario Marginalization Index (ON-Marg) Material Resources quintile per census tract, joined by tract to the same Peel geography as the heat map. A marginalization and affordability proxy for winter resilience need, deliberately not a fabricated cold-temperature index. St. Michael's Hospital and Public Health Ontario, from the StatCan 2021 Census.modelledpeel-fsa.geojson35 forward sortation areasStatistics Canada 2021 Census boundary file for forward sortation areas (the first three characters of a postal code), catalogue 92-179-X, reprojected to standard GPS coordinates. Statistics Canada Open Licence.verifiedpeel-facilities.geojson87 facility pointsStatistics Canada Open Database of Recreational and Sport Facilities (ODRSF): arenas, community centres, and pools across Peel's three municipalities, Mississauga, Brampton, and Caledon.verifiedcandidate-hubs.geojson10 hand-verified buildingsNames and addresses from official municipal, library, and faith-organization pages, geocoded with the ArcGIS World Geocoder, then point-queried against the Peel HVI service for each building's quintiles, census tract ID, and public-health zone.verifiedA static snapshot, not a live query
Every layer above is a frozen GeoJSON file, committed to this repository and read once at build time. There is no database and no live API call while you browse. That is on purpose: a dropped connection or an expired map token cannot break the demo. The only live element on the page is the embedded ArcGIS web map, an iframe. Nothing here is invented. Each value traces to the public source beside it, the extract is reproducible from a documented script, and the candidate scores were re-checked against the live Peel service on 2026-05-26.
What we hand-assign rather than fetch: the planning buckets (roof class, facility suitability, and the modelled 500 m catchment), plus the five scoring weights. Those are our judgement calls. They carry a modelled or pending label everywhere they appear, and never read as measured values.
Sources and stack
Every public claim is tied to a source and marked verified, modelled, or pending. The page is deliberately plain so anyone can trace the work.
HVI item used for public-health heat-risk context and source metadata.
Official web map that styles the same HVI feature service by quintile.
Point-queried for candidate HVI, exposure, sensitivity, adaptive-capacity, CTUID, and PHDZ fields.
Layer 6, Floodline TRCA Polygon: the riverine regulatory floodplain for the Humber, Etobicoke Creek, and Mimico Creek watersheds. Each candidate's flood proximity was point-queried against it and cross-checked with a local point-in-polygon pass.
The Credit watershed boundary, used to flag candidates that TRCA does not map, so they read 'not mapped by TRCA' rather than a false 'outside the floodplain'.
Material Resources quintile per census tract: the affordability and marginalization proxy behind the winter / energy-burden lens. St. Michael's Hospital (Unity Health Toronto) and Public Health Ontario, from the StatCan 2021 Census.
Real dissemination-area populations and StatCan representative points, summed into Malton's modelled 500 m catchment estimate. Populations cross-checked against ON-Marg's dissemination-area file.
Forward-sortation-area cartographic boundary file (catalogue 92-179-X) that draws the Peel outline on the map. Statistics Canada Open Licence.
Regional context for climate and health risk; not used for per-building claims.
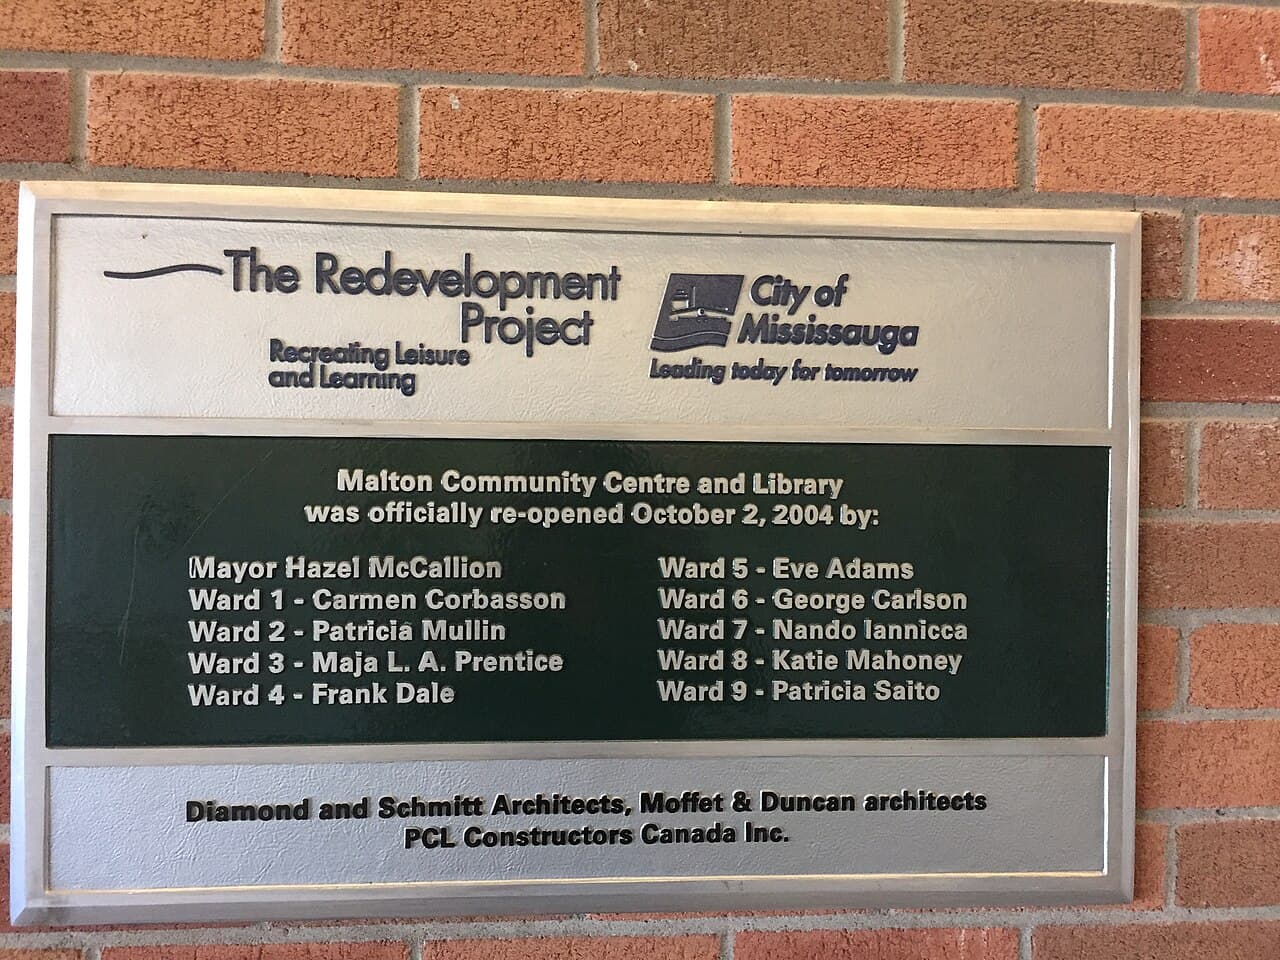
Used to check Malton Community Centre and Library name, address, and public facility role.
Supports a rough roof and footprint class only. It is not a solar-capacity measurement.
Supports rough roof/footprint class for Brampton candidates only.
Statistics Canada facility-reference dataset, used for public and community service context.
Regional solar context only. No named building is claimed solar-ready.
Precedent for trusted refuge networks; not a claim about solar or Peel deployment.
Funding context: tax-exempt community buildings can reach the 15% CEITC, which is eligibility, not guaranteed funding.
Funding contrast: the 30% credit is for taxable corporations only, so a tax-exempt community owner cannot claim it directly.
Open municipal grant-and-loan program for community-building energy retrofits, cited on the Funding page.
Ontario efficiency program covering up to half of an eligible retrofit, including behind-the-meter solar.
Federal clean-energy capital program named on the Funding page; main streams are not accepting proposals as of 2026.
The primary map artifact that carries the candidate points and ranked view.
The primary deliverable. It carries the HVI layer, the candidate points, and the ranked view.
This showcase: a server-rendered shell with one interactive map island and no backend.
Projects Peel geography and the candidate points. No basemap token, fully offline.
Candidate data is bundled at build, so it stays auditable and demo-safe with no runtime fetch.
Drafts each candidate's planning checklist offline, behind a no-overclaim gate that rejects invented power, dollar, or sizing figures. The reviewed text ships as static JSON, so the live site calls no model at runtime.
These links back the names, addresses, and public/community roles in the seed list.
Primary artifact
It carries the live Peel HVI layer, the candidate points, and the ranked view. This site explains it and stands in if the live map is slow to load.
Malton field notes
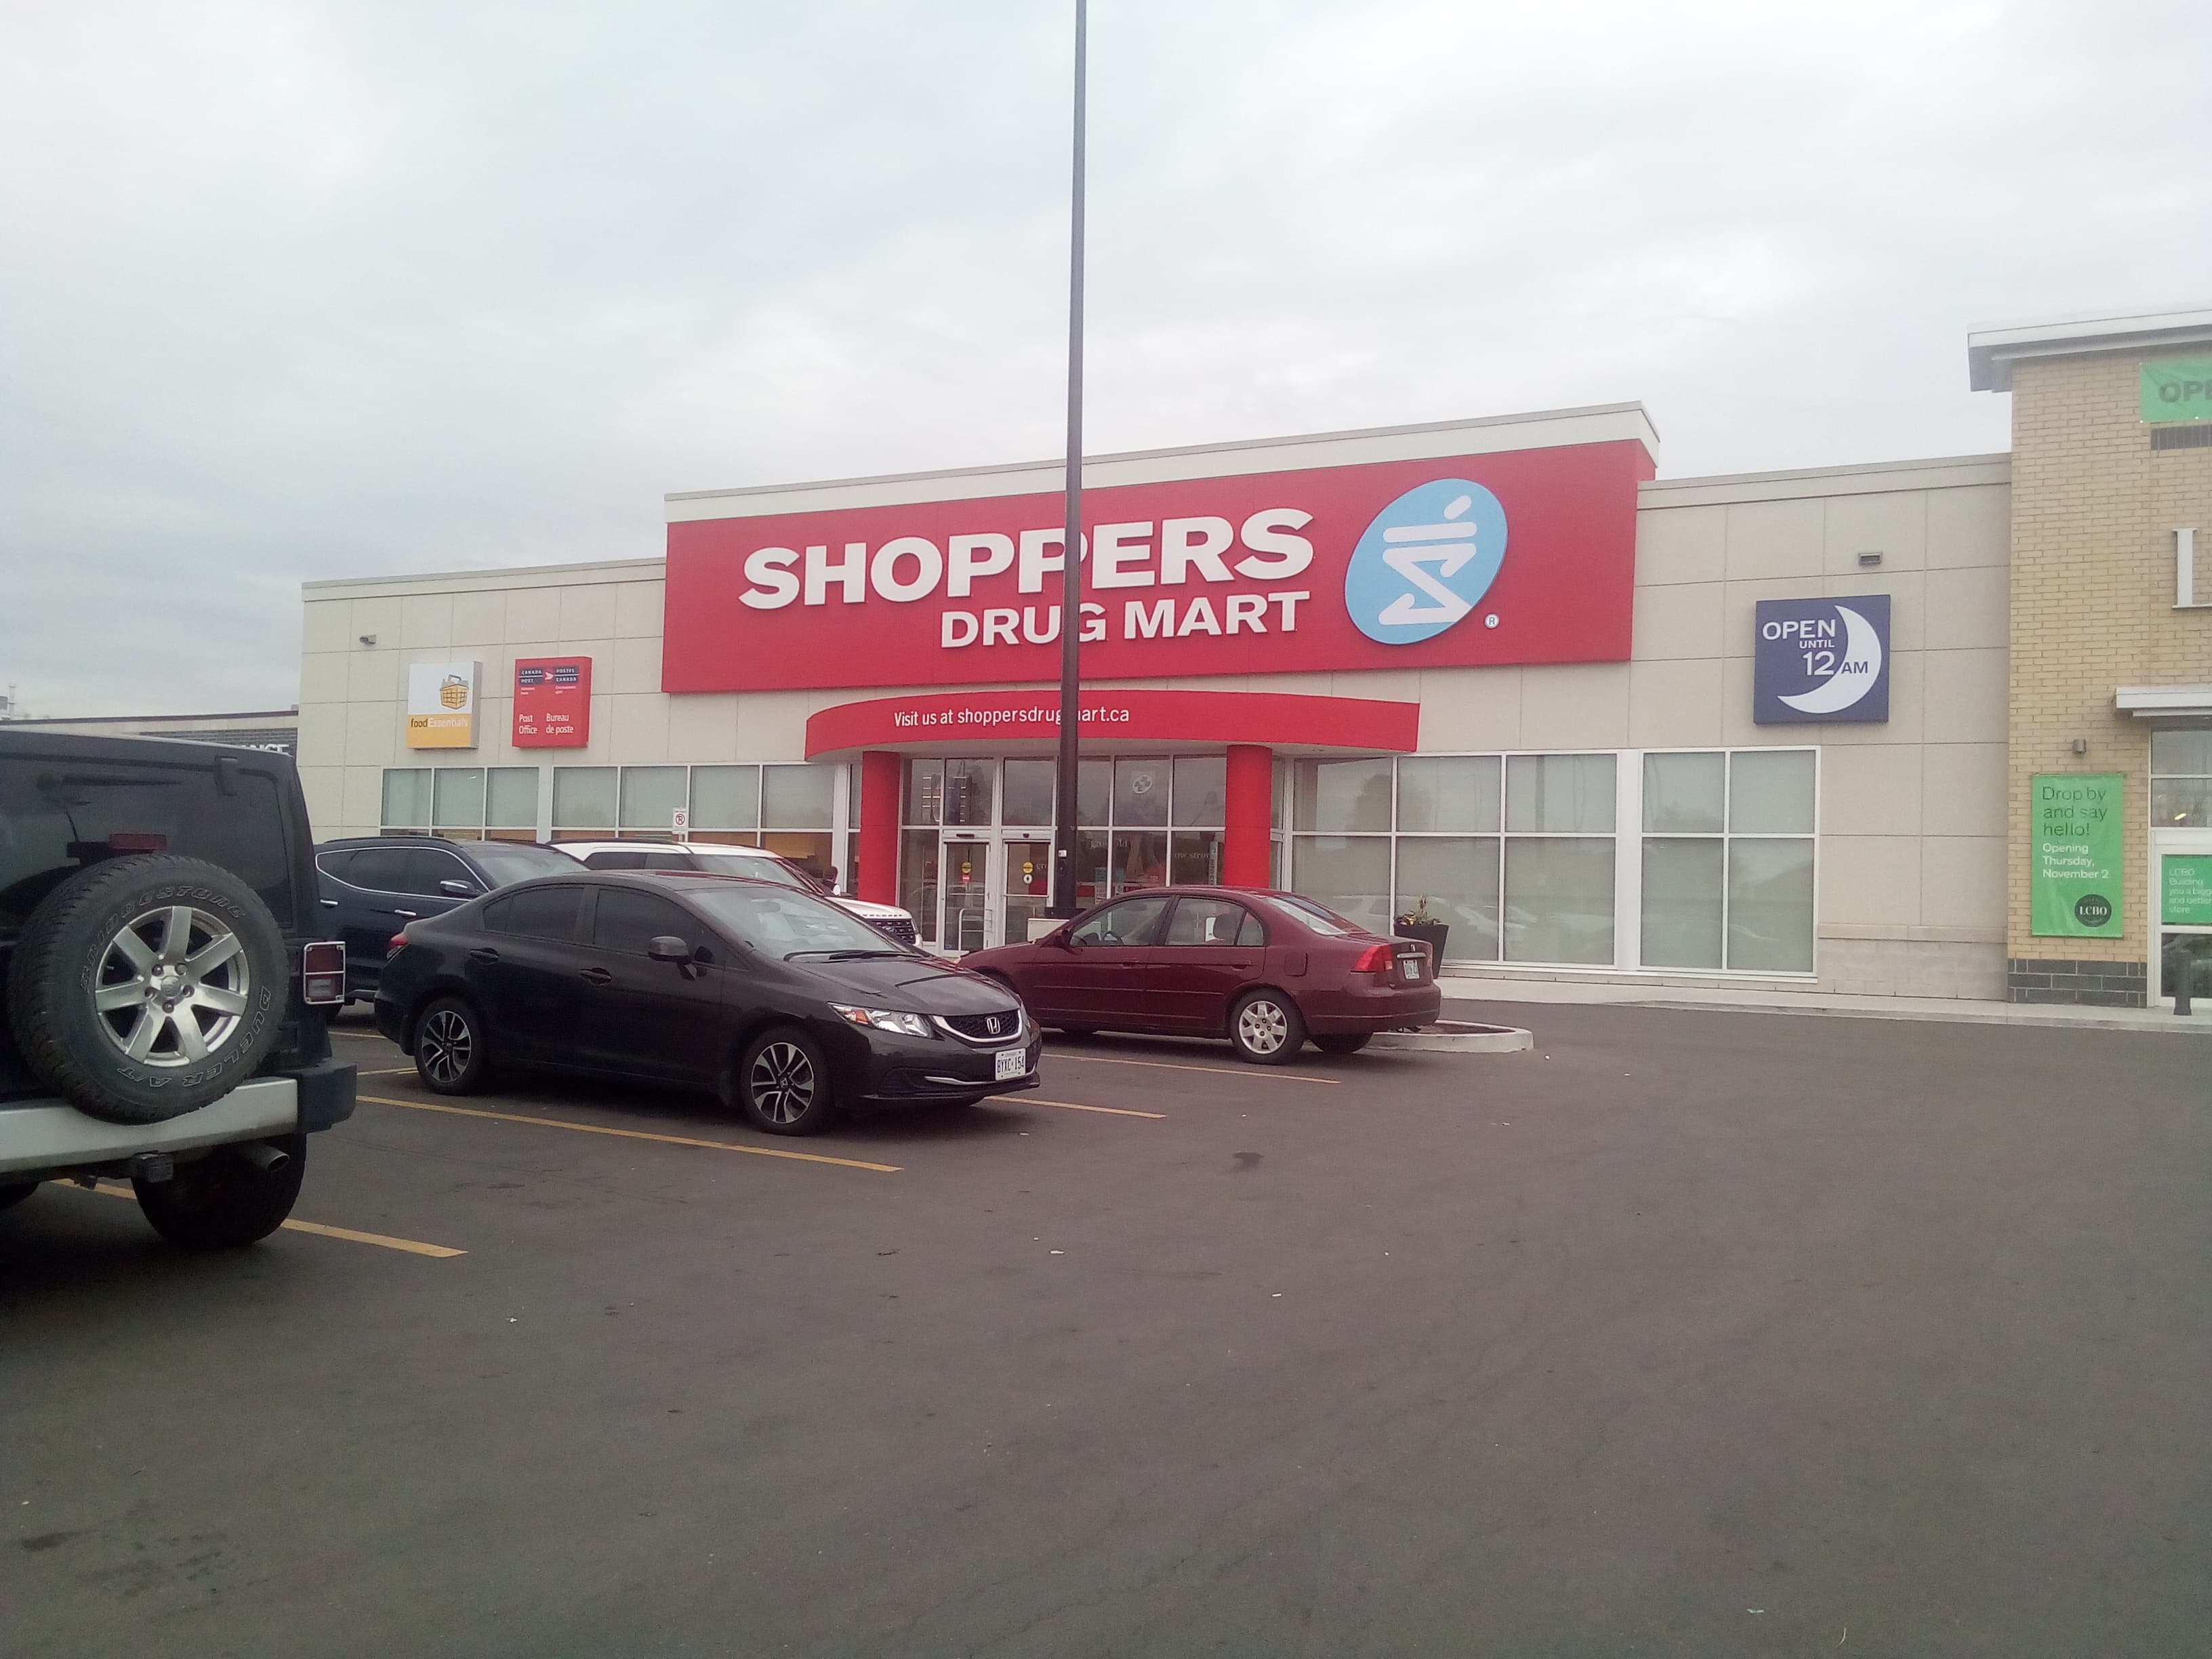
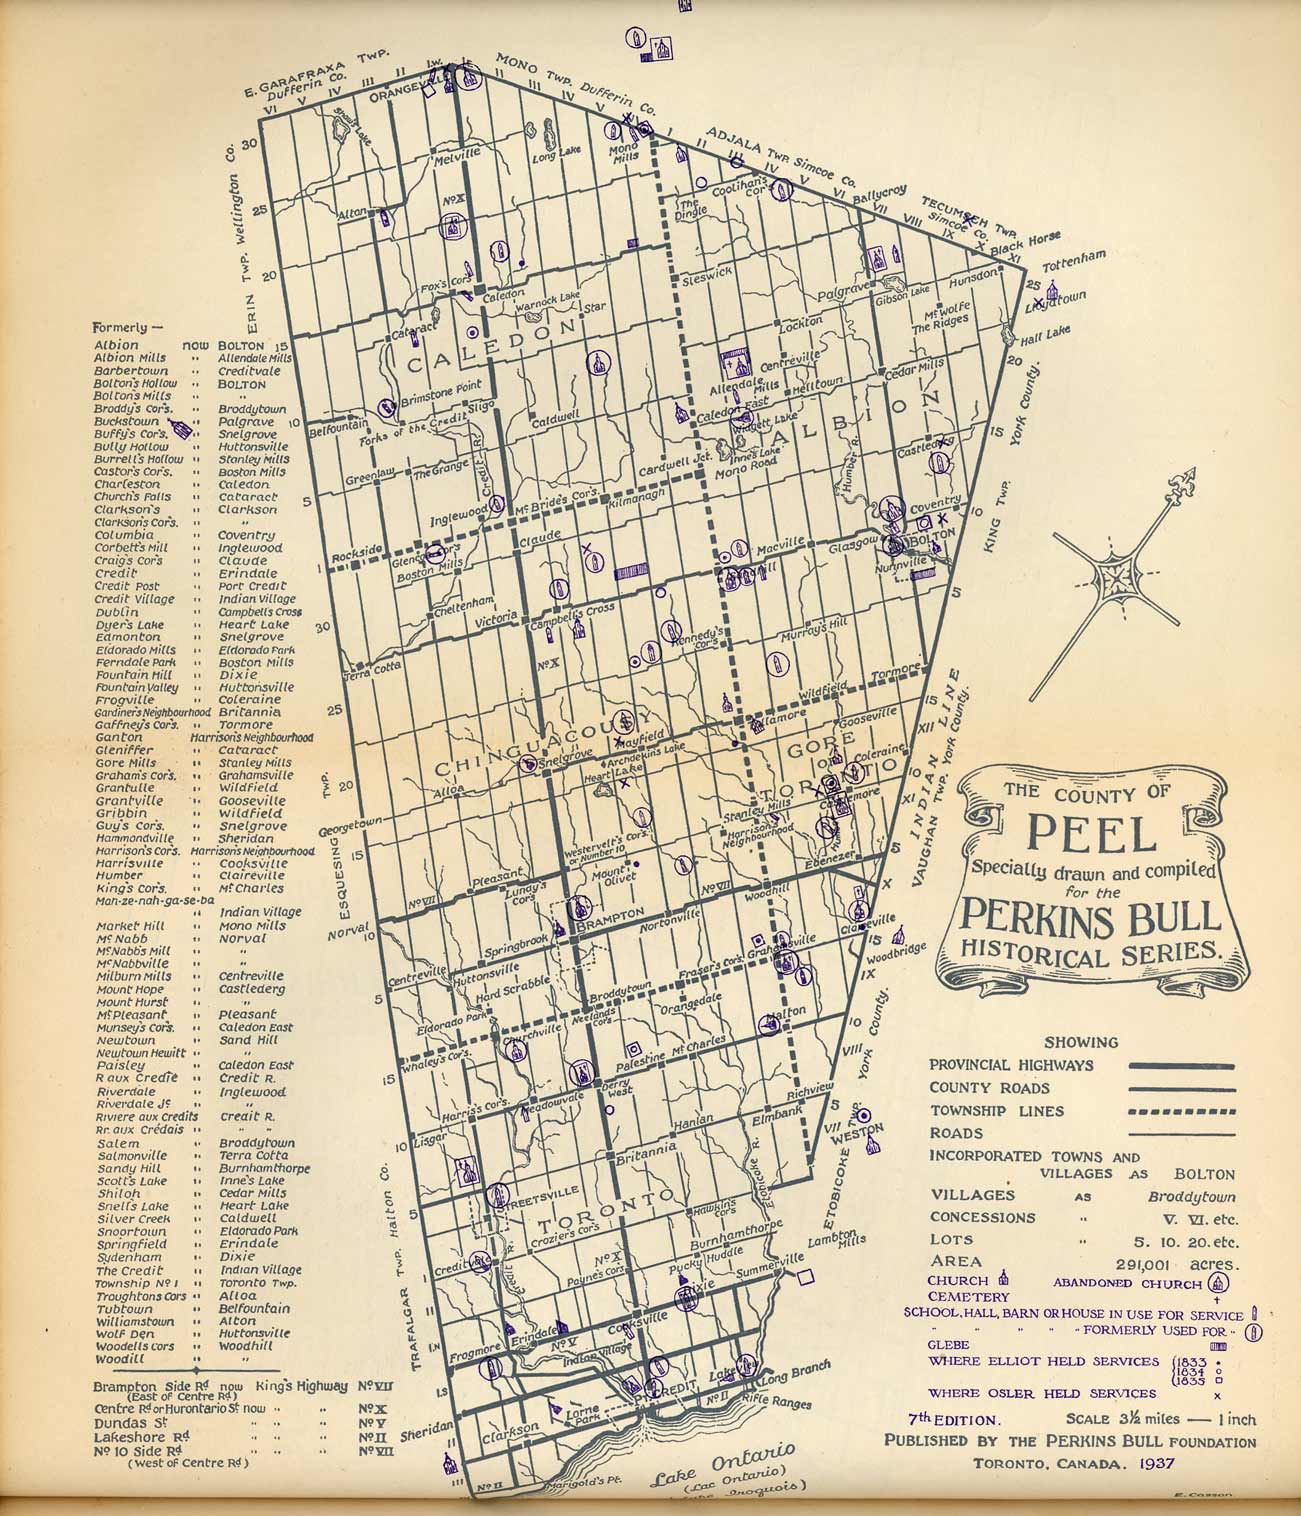
The photographs are local or archival Commons files. They are here to ground the page in Malton and Peel, not to imply any building is already equipped.
Common questions
No. They are candidate hubs. Sanctuary ranks where hardening should be investigated first.
No. They are planning estimates from rough roof class and regional solar context. The real output is the siting and prioritization layer.
Not yet. The prototype uses a modelled 500 m catchment and labels it as such until a real walkshed is run.
It's a frozen snapshot, on purpose. Each map layer is a GeoJSON file pulled from a public source (Peel's HVI service, Statistics Canada boundaries, municipal facility data), committed to the repo and loaded at build time, so it can't break from a dropped connection. The values aren't invented. They trace to the sources on this page and were re-verified against the live Peel service on 2026-05-26.
Because resilience runs on trust, volunteers, and local knowledge. Gurdwaras, mosques, mandirs, and churches are community infrastructure.
No. The list mixes civic and faith buildings and frames every site as an asset, not as a group that needs rescuing.
That may be part of the answer. Sanctuary helps decide where new or upgraded safe spaces protect vulnerable residents first.
Yes, as a planning concept: a way to find community-energy and resilience-hub candidates before deeper engineering and partner engagement.
For a public owner the anchor is the 15% refundable Clean Electricity Investment Tax Credit, the one federal credit tax-exempt owners can reach. It stacks with the FCM Green Municipal Fund retrofit package and Ontario's Save on Energy program. The 30% Clean Technology credit is for taxable corporations only, so it is not the lever for a library or place of worship. See the Funding page.
Verify the top five with owners, replace buffers with real walksheds, run site audits, compare funding paths, then repeat across the territory.